
EPEX Intraday Continuous Market
All the data you need to understand the EPEX Continuous Intraday market, all in one place
Power is traded continuously in GB on the EPEX SPOT exchange, as part of the continuous intraday market. Trades can occur right up until the beginning of the delivery period, so traders can make near real-time adjustments to trading positions and respond to any rapid changes in prices using the continuous market.
We are now one of a handful of providers who can redistribute this data, and it's all real-time - we use Kafka to make sure we process everything as soon as it happens, with millisecond latency.
How does the continuous intraday market work?
The continuous intraday power market in GB operates via an open order book. Traders submit buy and sell orders to buy or sell a volume of power for a specific delivery window. There are lots of different products available to trade on the continuous intraday market, which each have a separate order book. There are ~96 products (aka contracts) available each day, and each product is for power to be delivered in a specific delivery window. Every day there are 48 half-hour products, 24 1-hour products, etc, all the way up to base / peak products (you can check out which products are available to trade via our Contract Info endpoint).
Open buy and sell orders are shown on a trading screen, and traders can buy or sell directly to these at the prices shown, or they can submit their own buy or sell order for a different price, and wait for this to be fulfilled by another trader. When a buy and a sell order match, or a trader accepts an open order, a trade is executed at the price of that specific order. Because of this, there is not one single price per settlement period (unlike the day-ahead or intraday auctions). It is 'pay as bid' rather than 'pay as clear', with lots (and lots) of individual trades between parties.
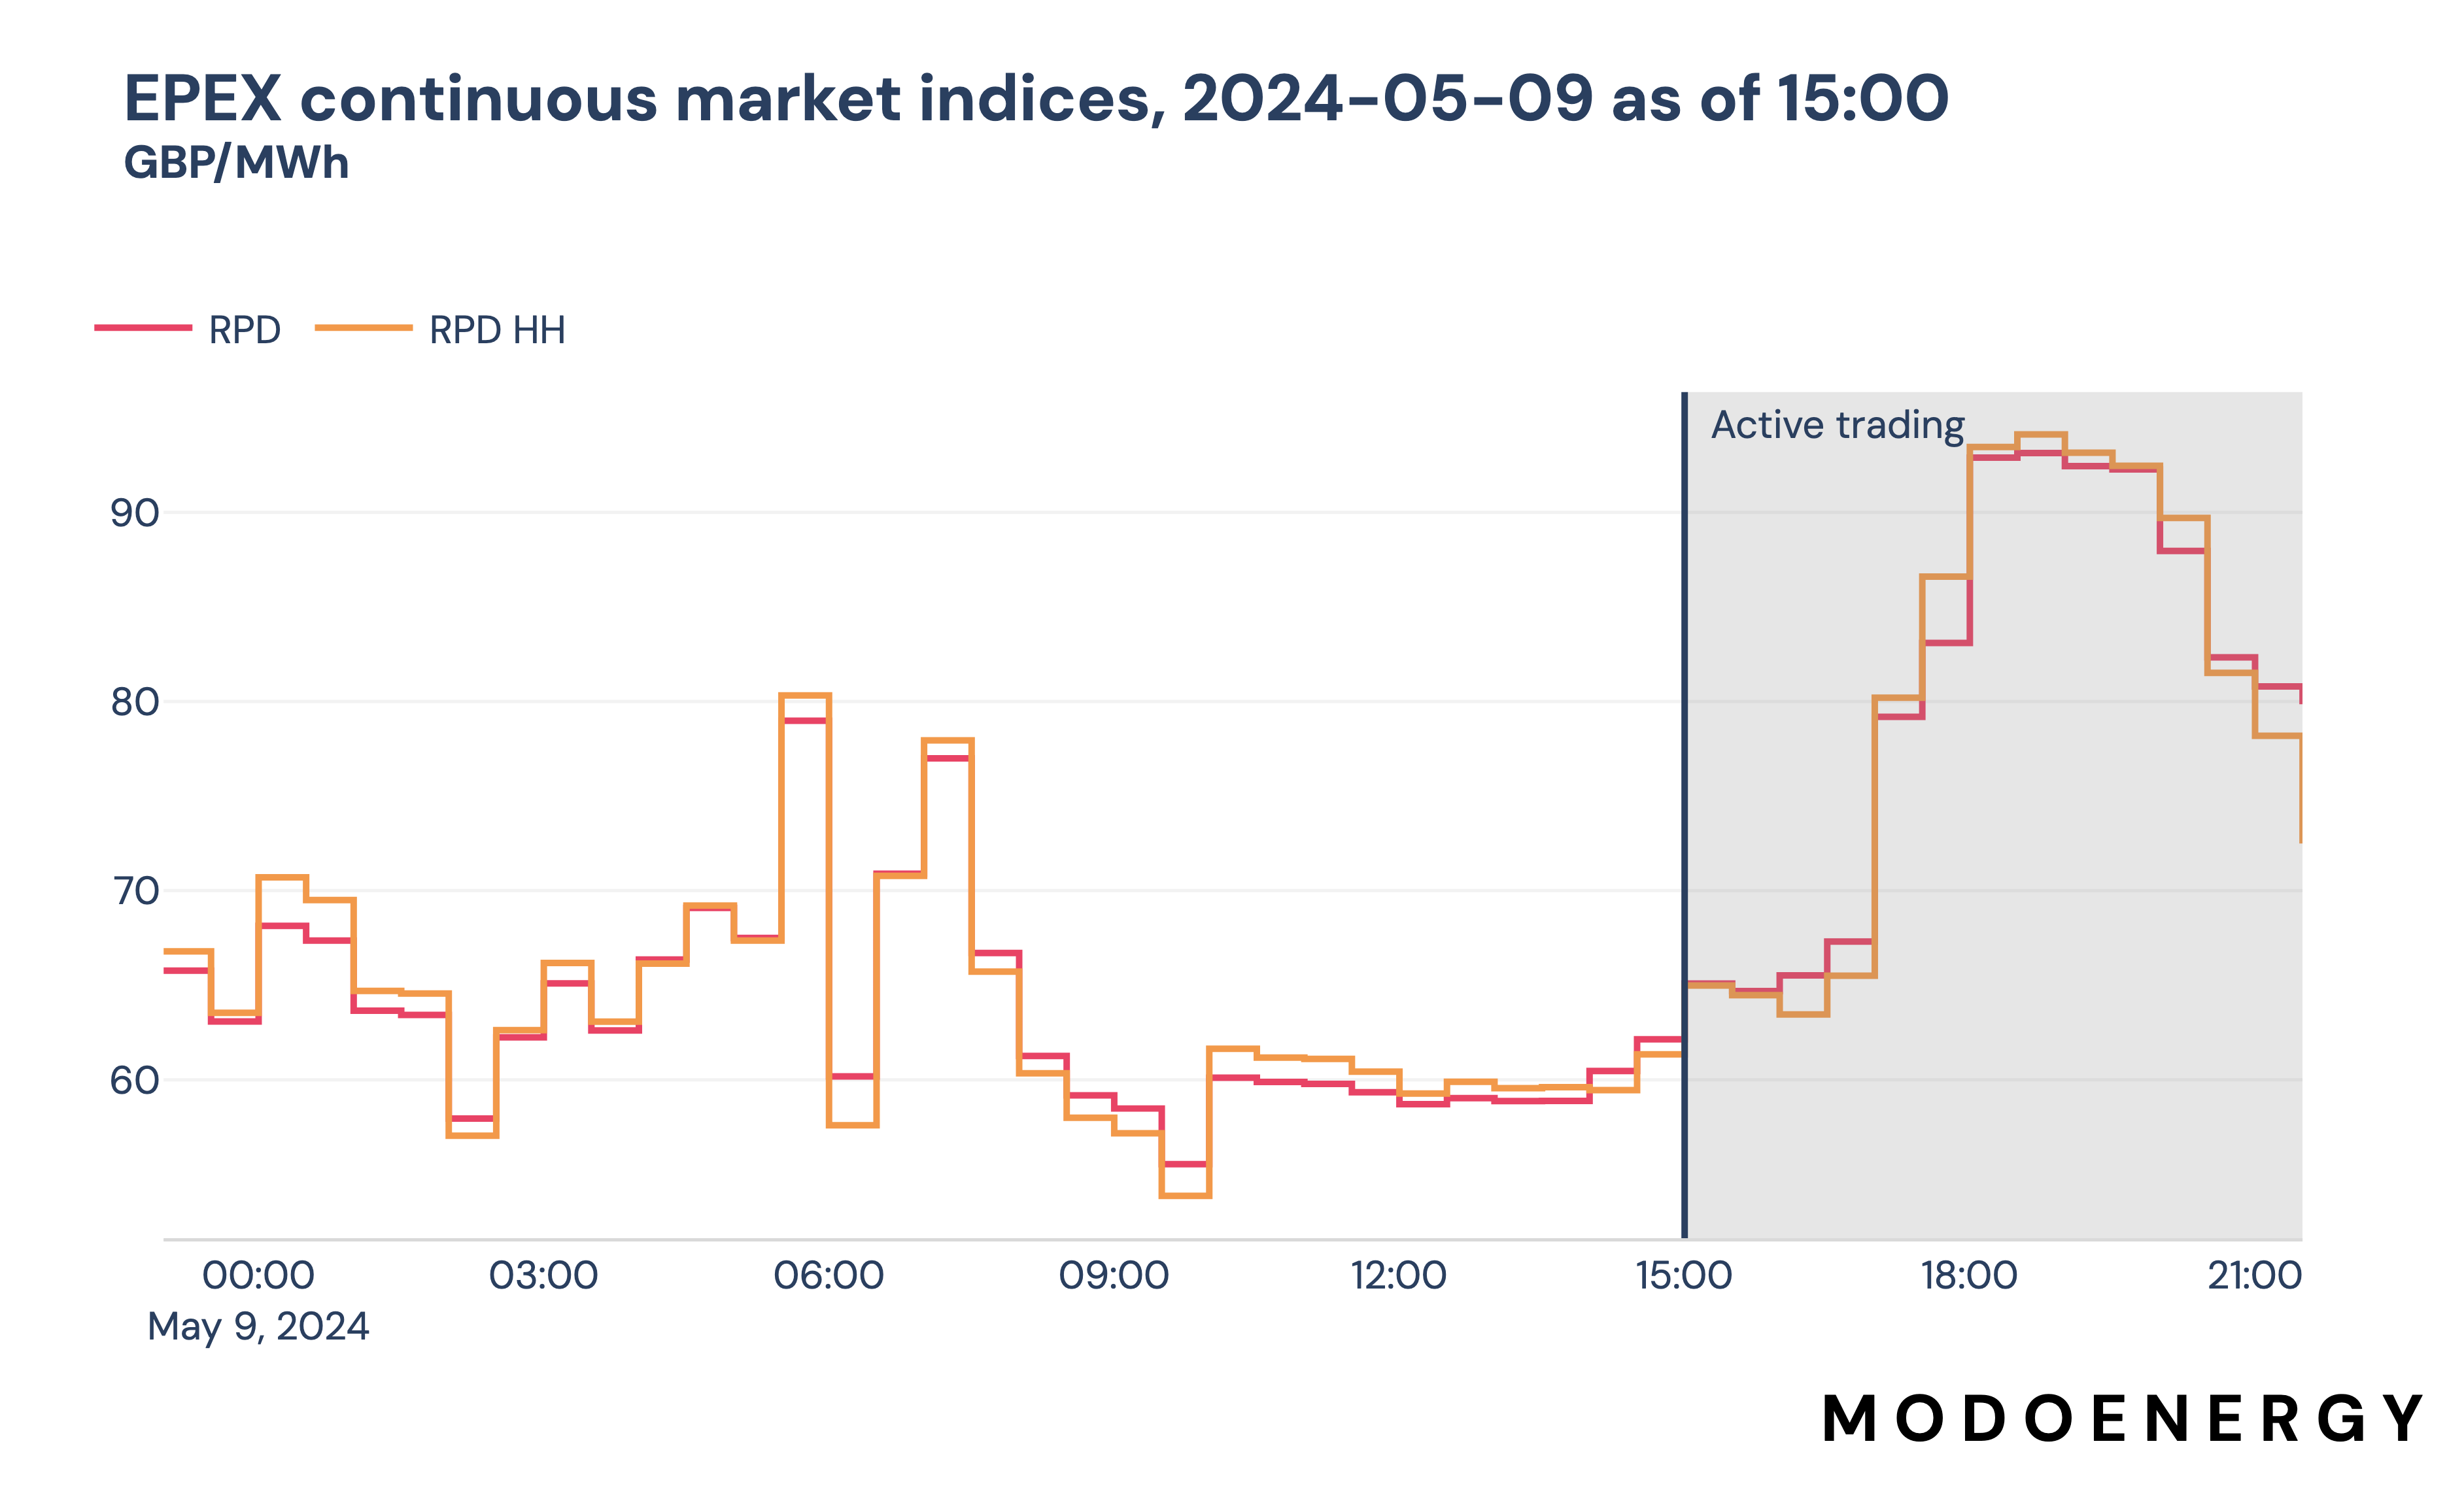
Whilst knowing the price of every single trade can be super useful, often it's enough to know the average price of trades for power to be delivered across a specific settlement period. There are two well known indexes for the continuous intraday market, RPD and RPD HH. Both indexes are produced every half hour, but RPD HH only includes trades of half-hourly products, so it generally sees much more intraday movement.
When market (and system) conditions change you often see rapid movement in prices on the continuous market. For example, let's say a wind front is late coming in and the system looks like it's going to be tighter than forecast. You would expect to see lots of traders looking to acquire additional power to make up for the shortfall, which will likely push up prices. These swings represent major opportunities for keen eyed market participants.
What data is available?
You can find all these endpoints in the API docs in the EPEX Live Continuous section under EPEX.
| Dataset | Description |
|---|---|
| Order book | Details of every buy and sell order placed on the market, including updates as orders transact or are cancelled |
| Contract info | Information about each contract (product) that can be traded on the market, such as duration, and delivery start |
| Trade report | Details of every trade which transacts in the market |
| RPD | Volume weighted average price of trades for 4, 2, 1, and half-hour products, with half-hour granularity |
| RPD HH | Volume weighted average price of trades for half-hour products only, with half-hour granularity |
| OHLC | Opening, high, low, and closing prices of trades for half-hour products |
More information on each of these, and what you can do with them, below.
What can you visualise with this data?
Summary of continuous intraday prices using RPD and RPD HH indexes
At 30 minute granularity, we calculate the volume weighted average price of trades for 4h, 2h, 1h and half-hour products to build the RPD index, and the half-hour products to build the RPD HH index. The endpoints also include the total volume of trades within each index.
Because products can be traded from several hours before, right up until delivery, these indexes only get 'locked in' once the delivery window begins. Therefore these indexes are available for all delivery period for which any trades have taken place, and will update as soon as new trades are submitted.
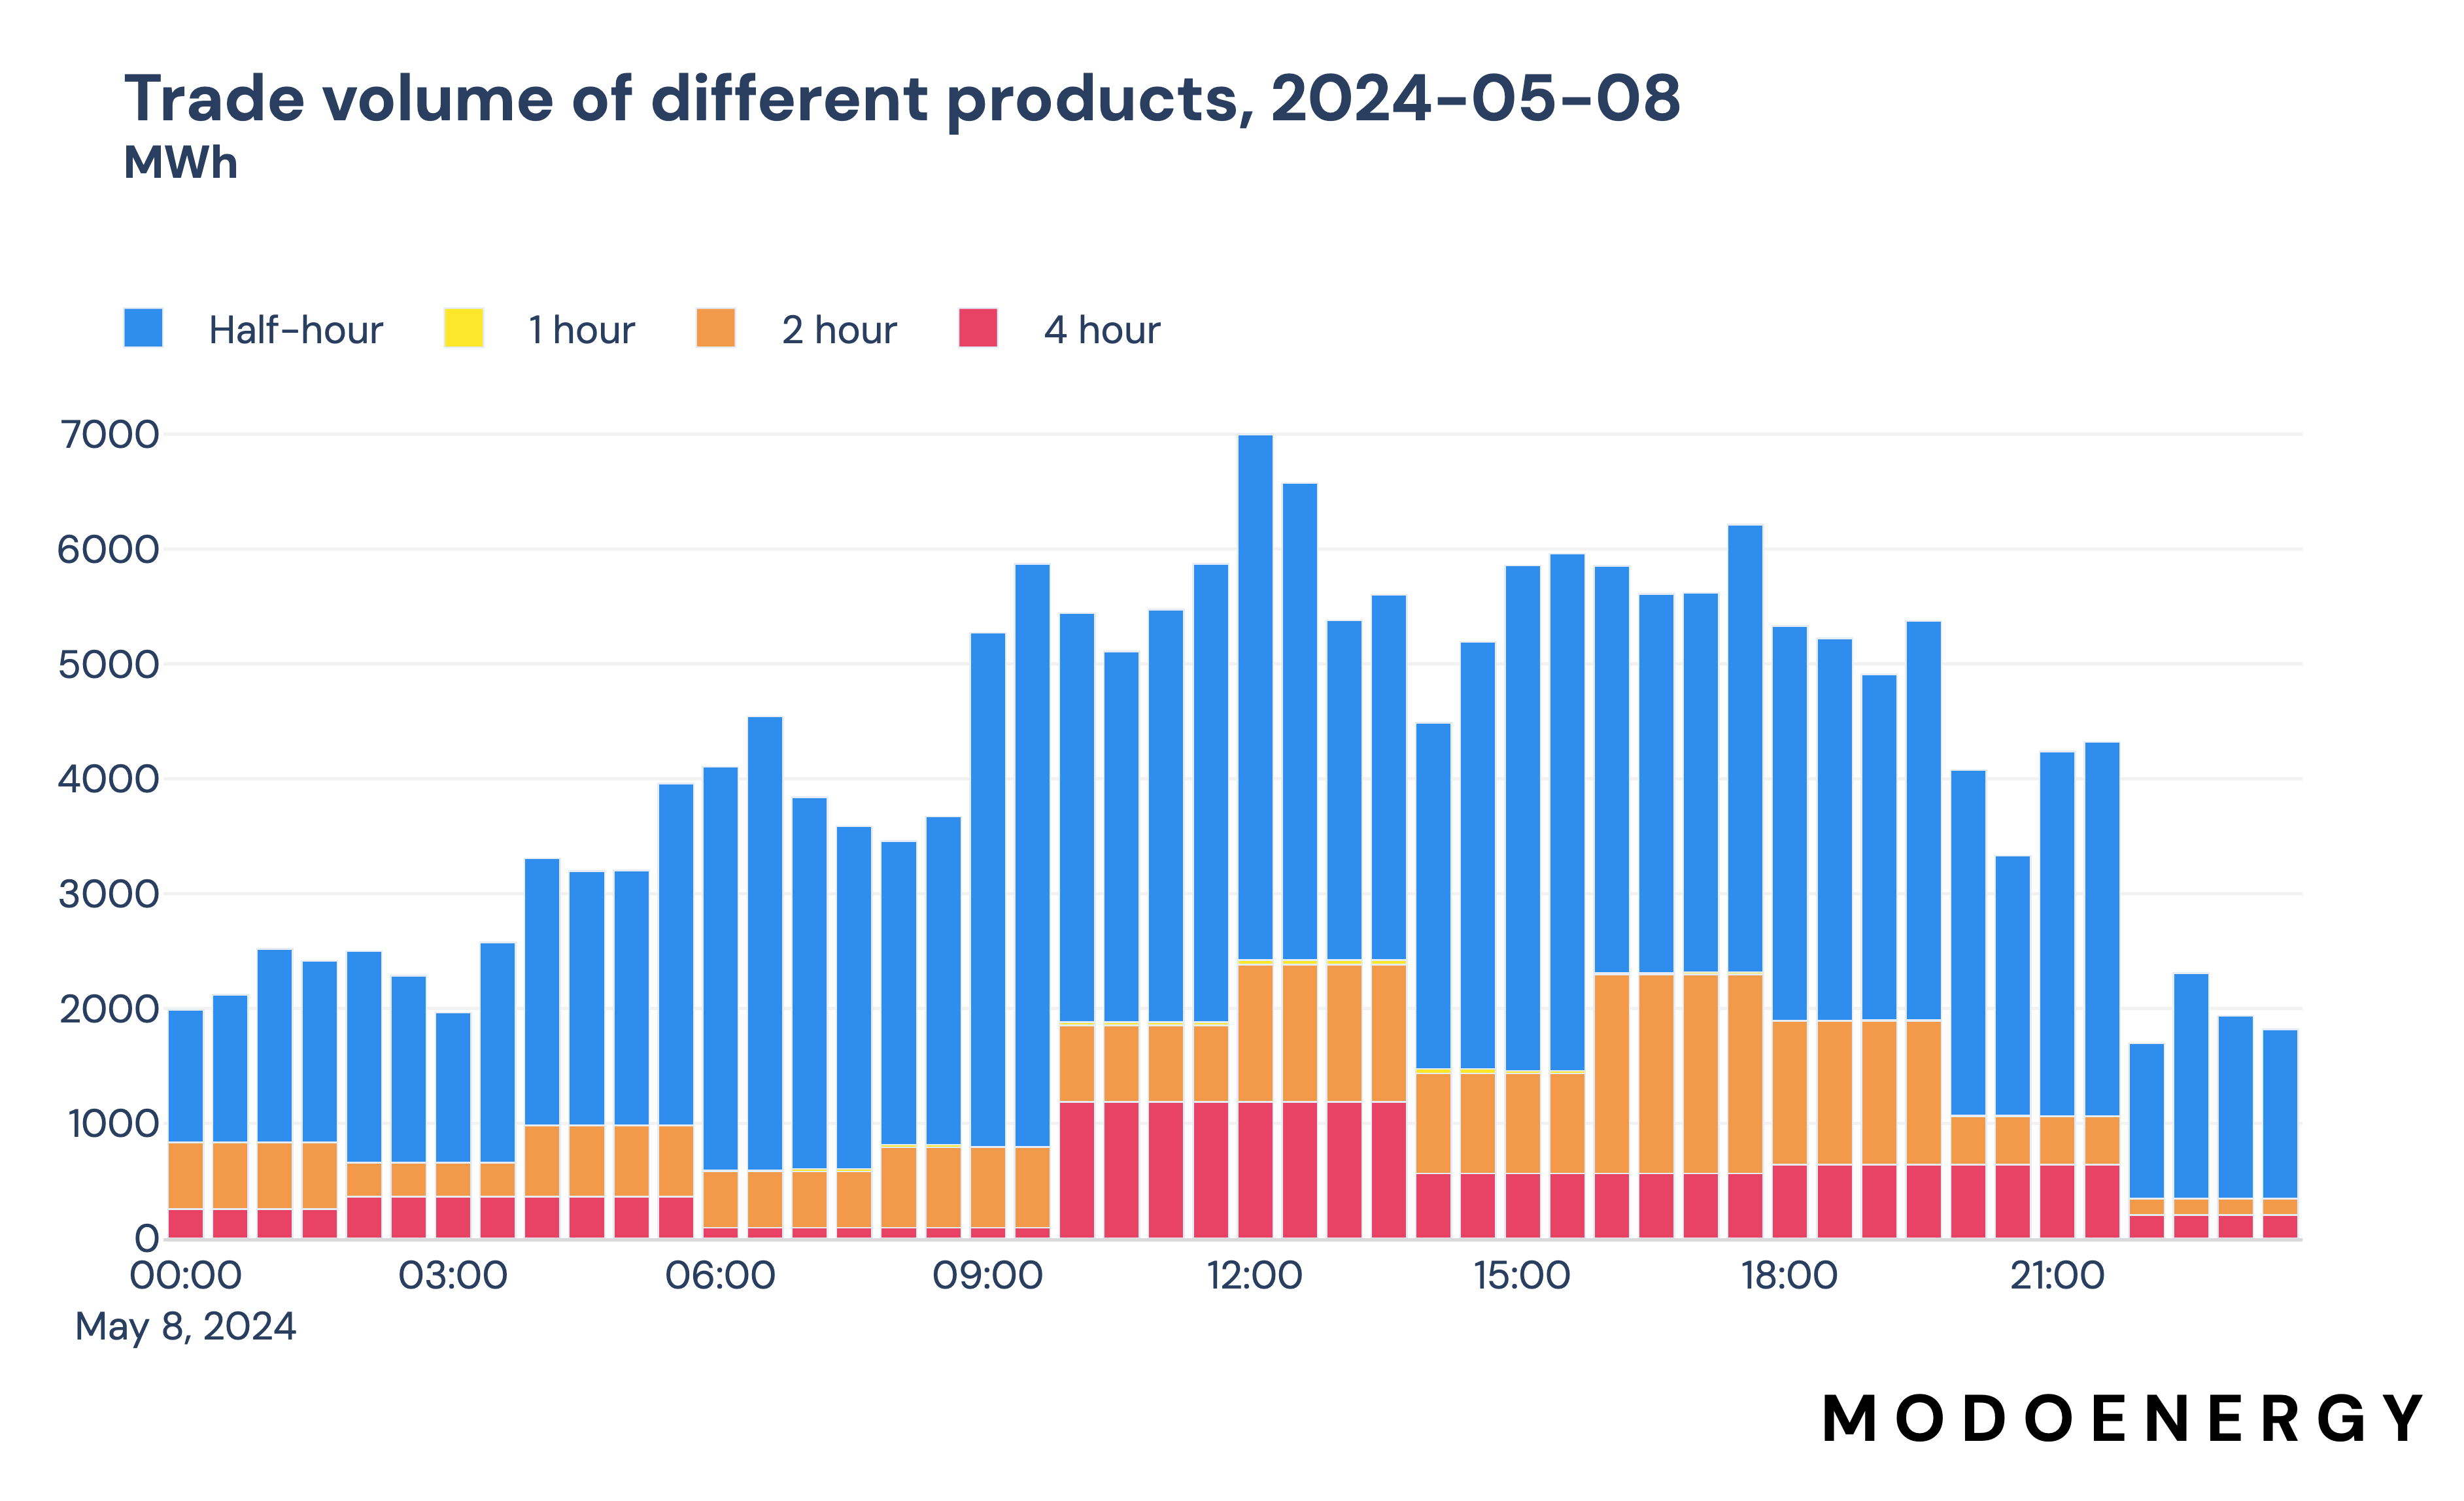
Compare the volumes of different duration products
You can see that the majority of the volume traded on the intraday continuous market is half-hour products. This makes sense as the continuous market allows operators to make fine adjustments to their demand/supply close to real-time. Interestingly though, 2 and 4 hour products also see a good amount of volume traded, but 1 hour products are barely touched.
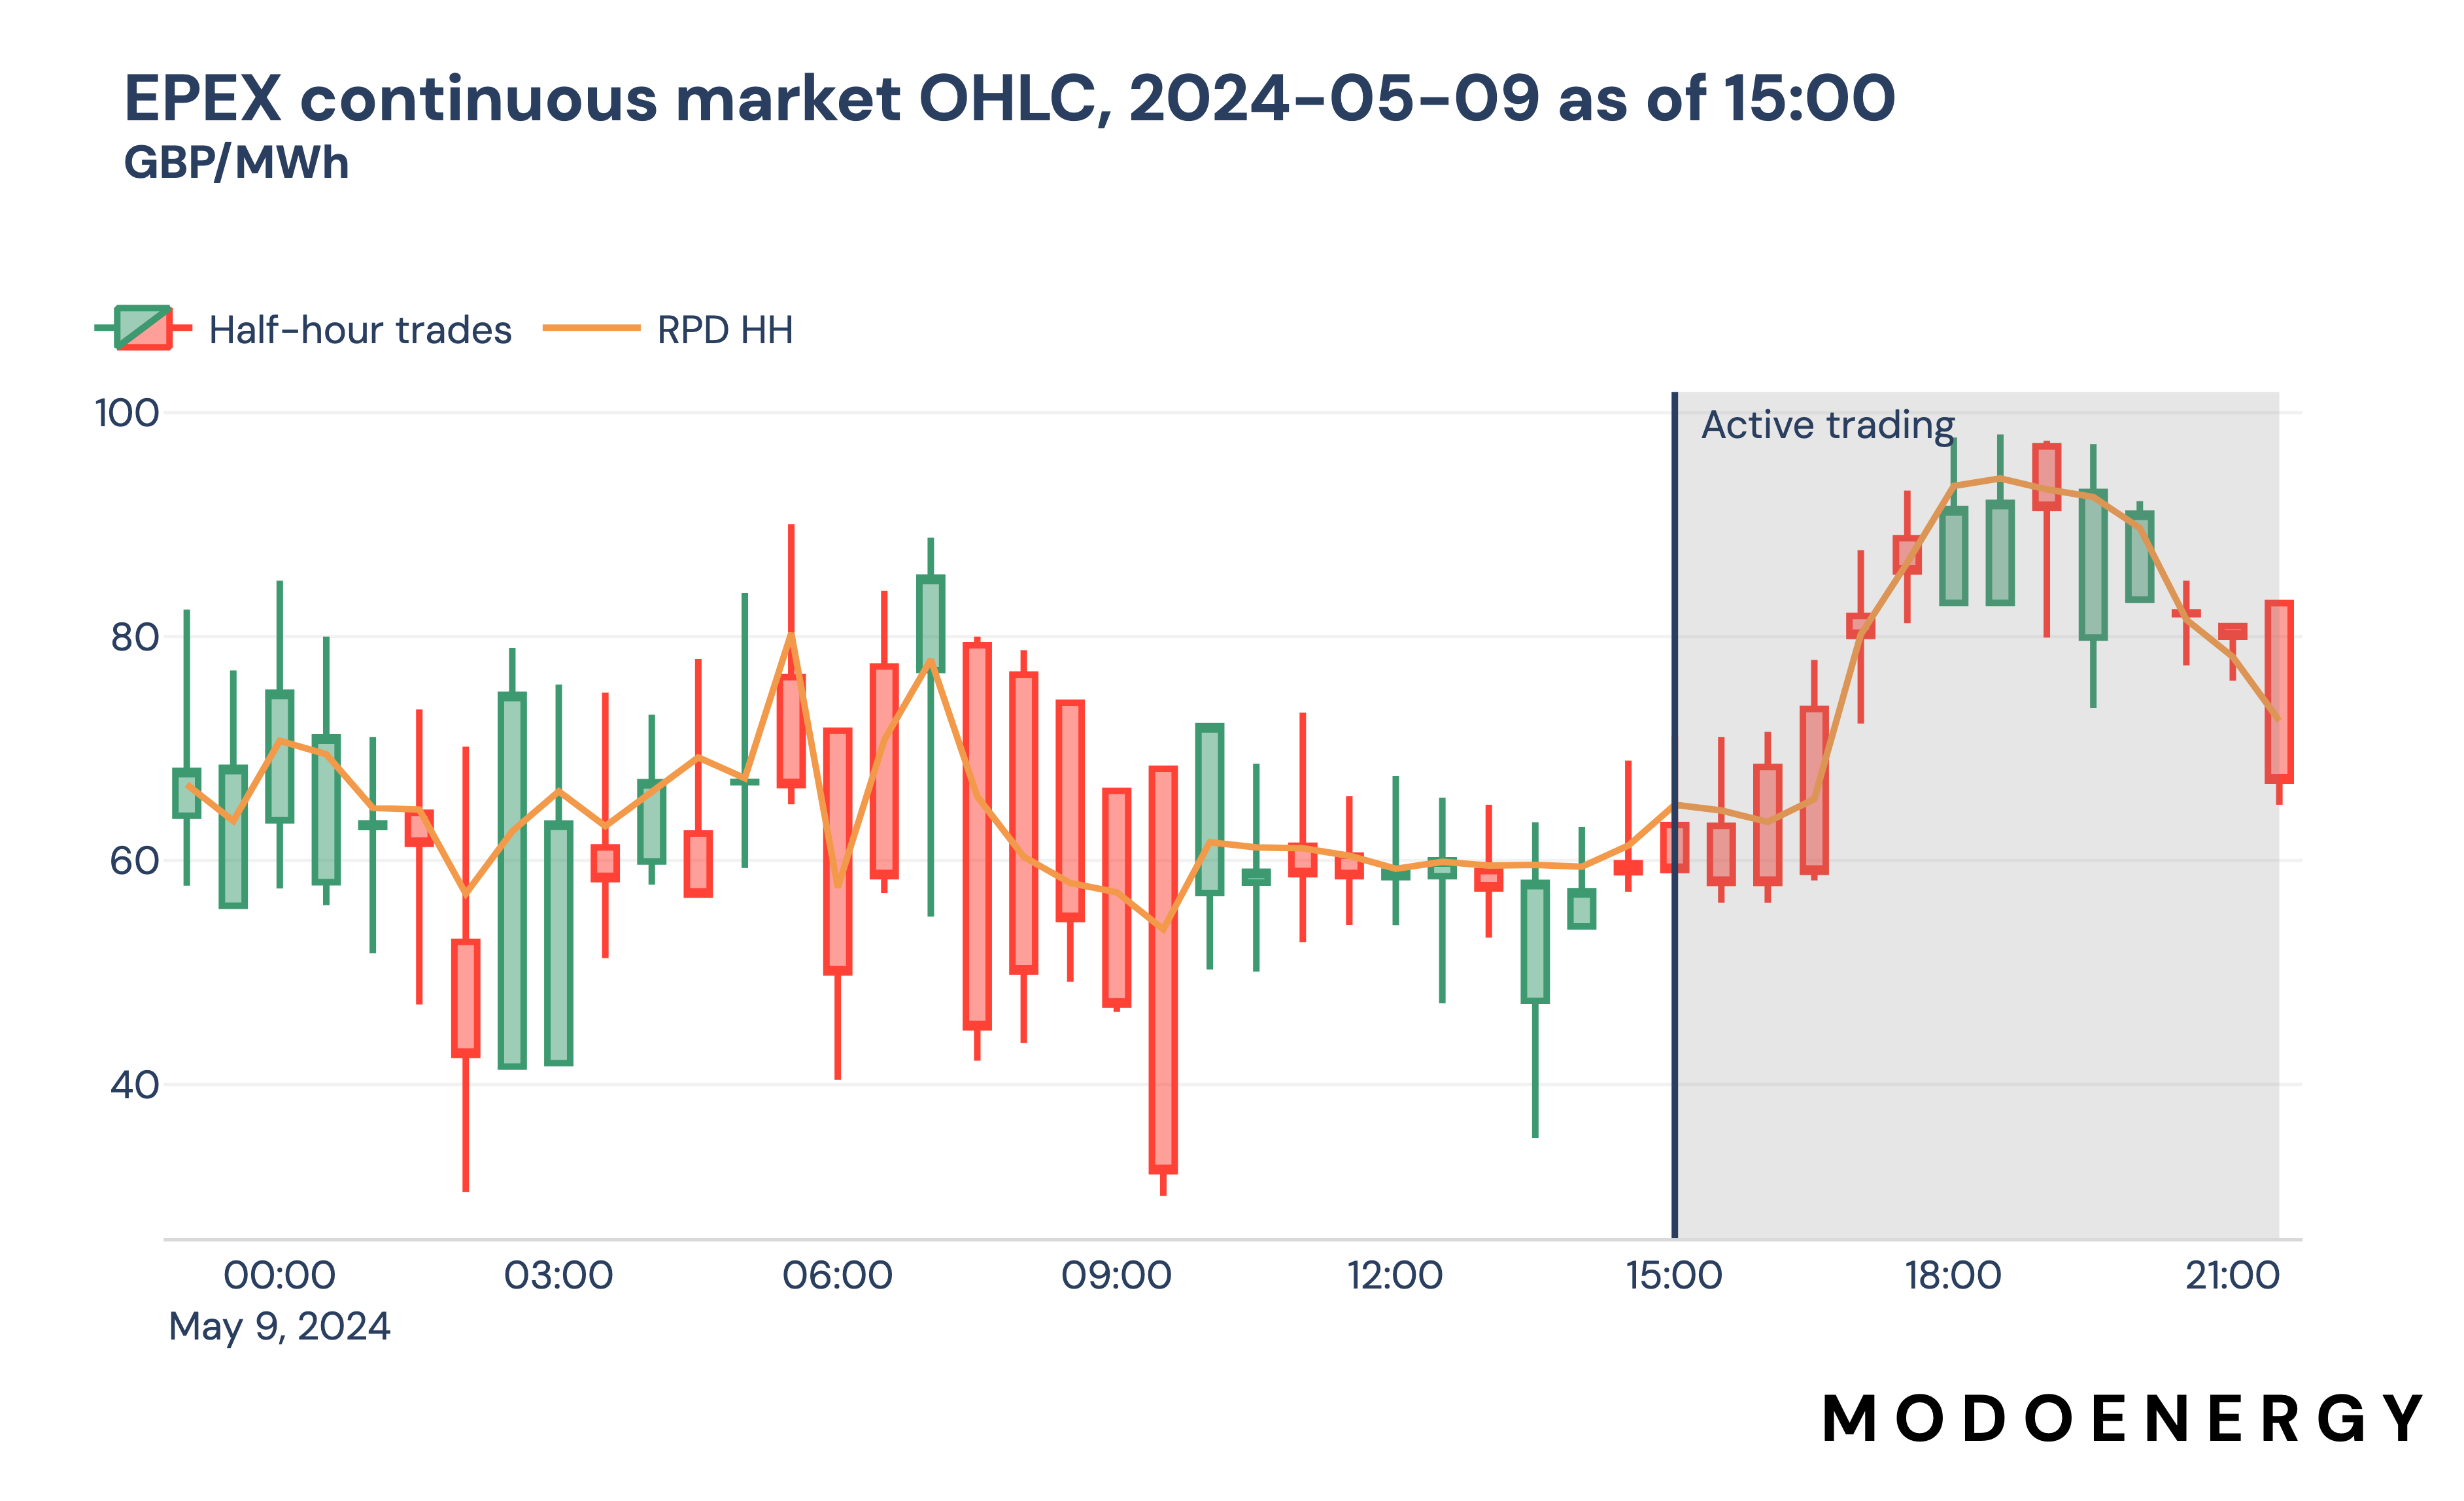
How prices for half-hour products change in real-time
Candlestick plots are a great way of visualising financial data - they show the prices of the opening and closing trades, as well as the highest and lowest prices traded. The lines show the highest and lowest trades, and the boxes show the opening and closing trade. Whether the box is green or red indicates whether the closing trade was higher than the opening trade (green) or vice versa (red).
By watching how these plots evolve in real-time you can get a really good idea of how the market is evolving, and potentially take advantage of any trading opportunities as they arise.
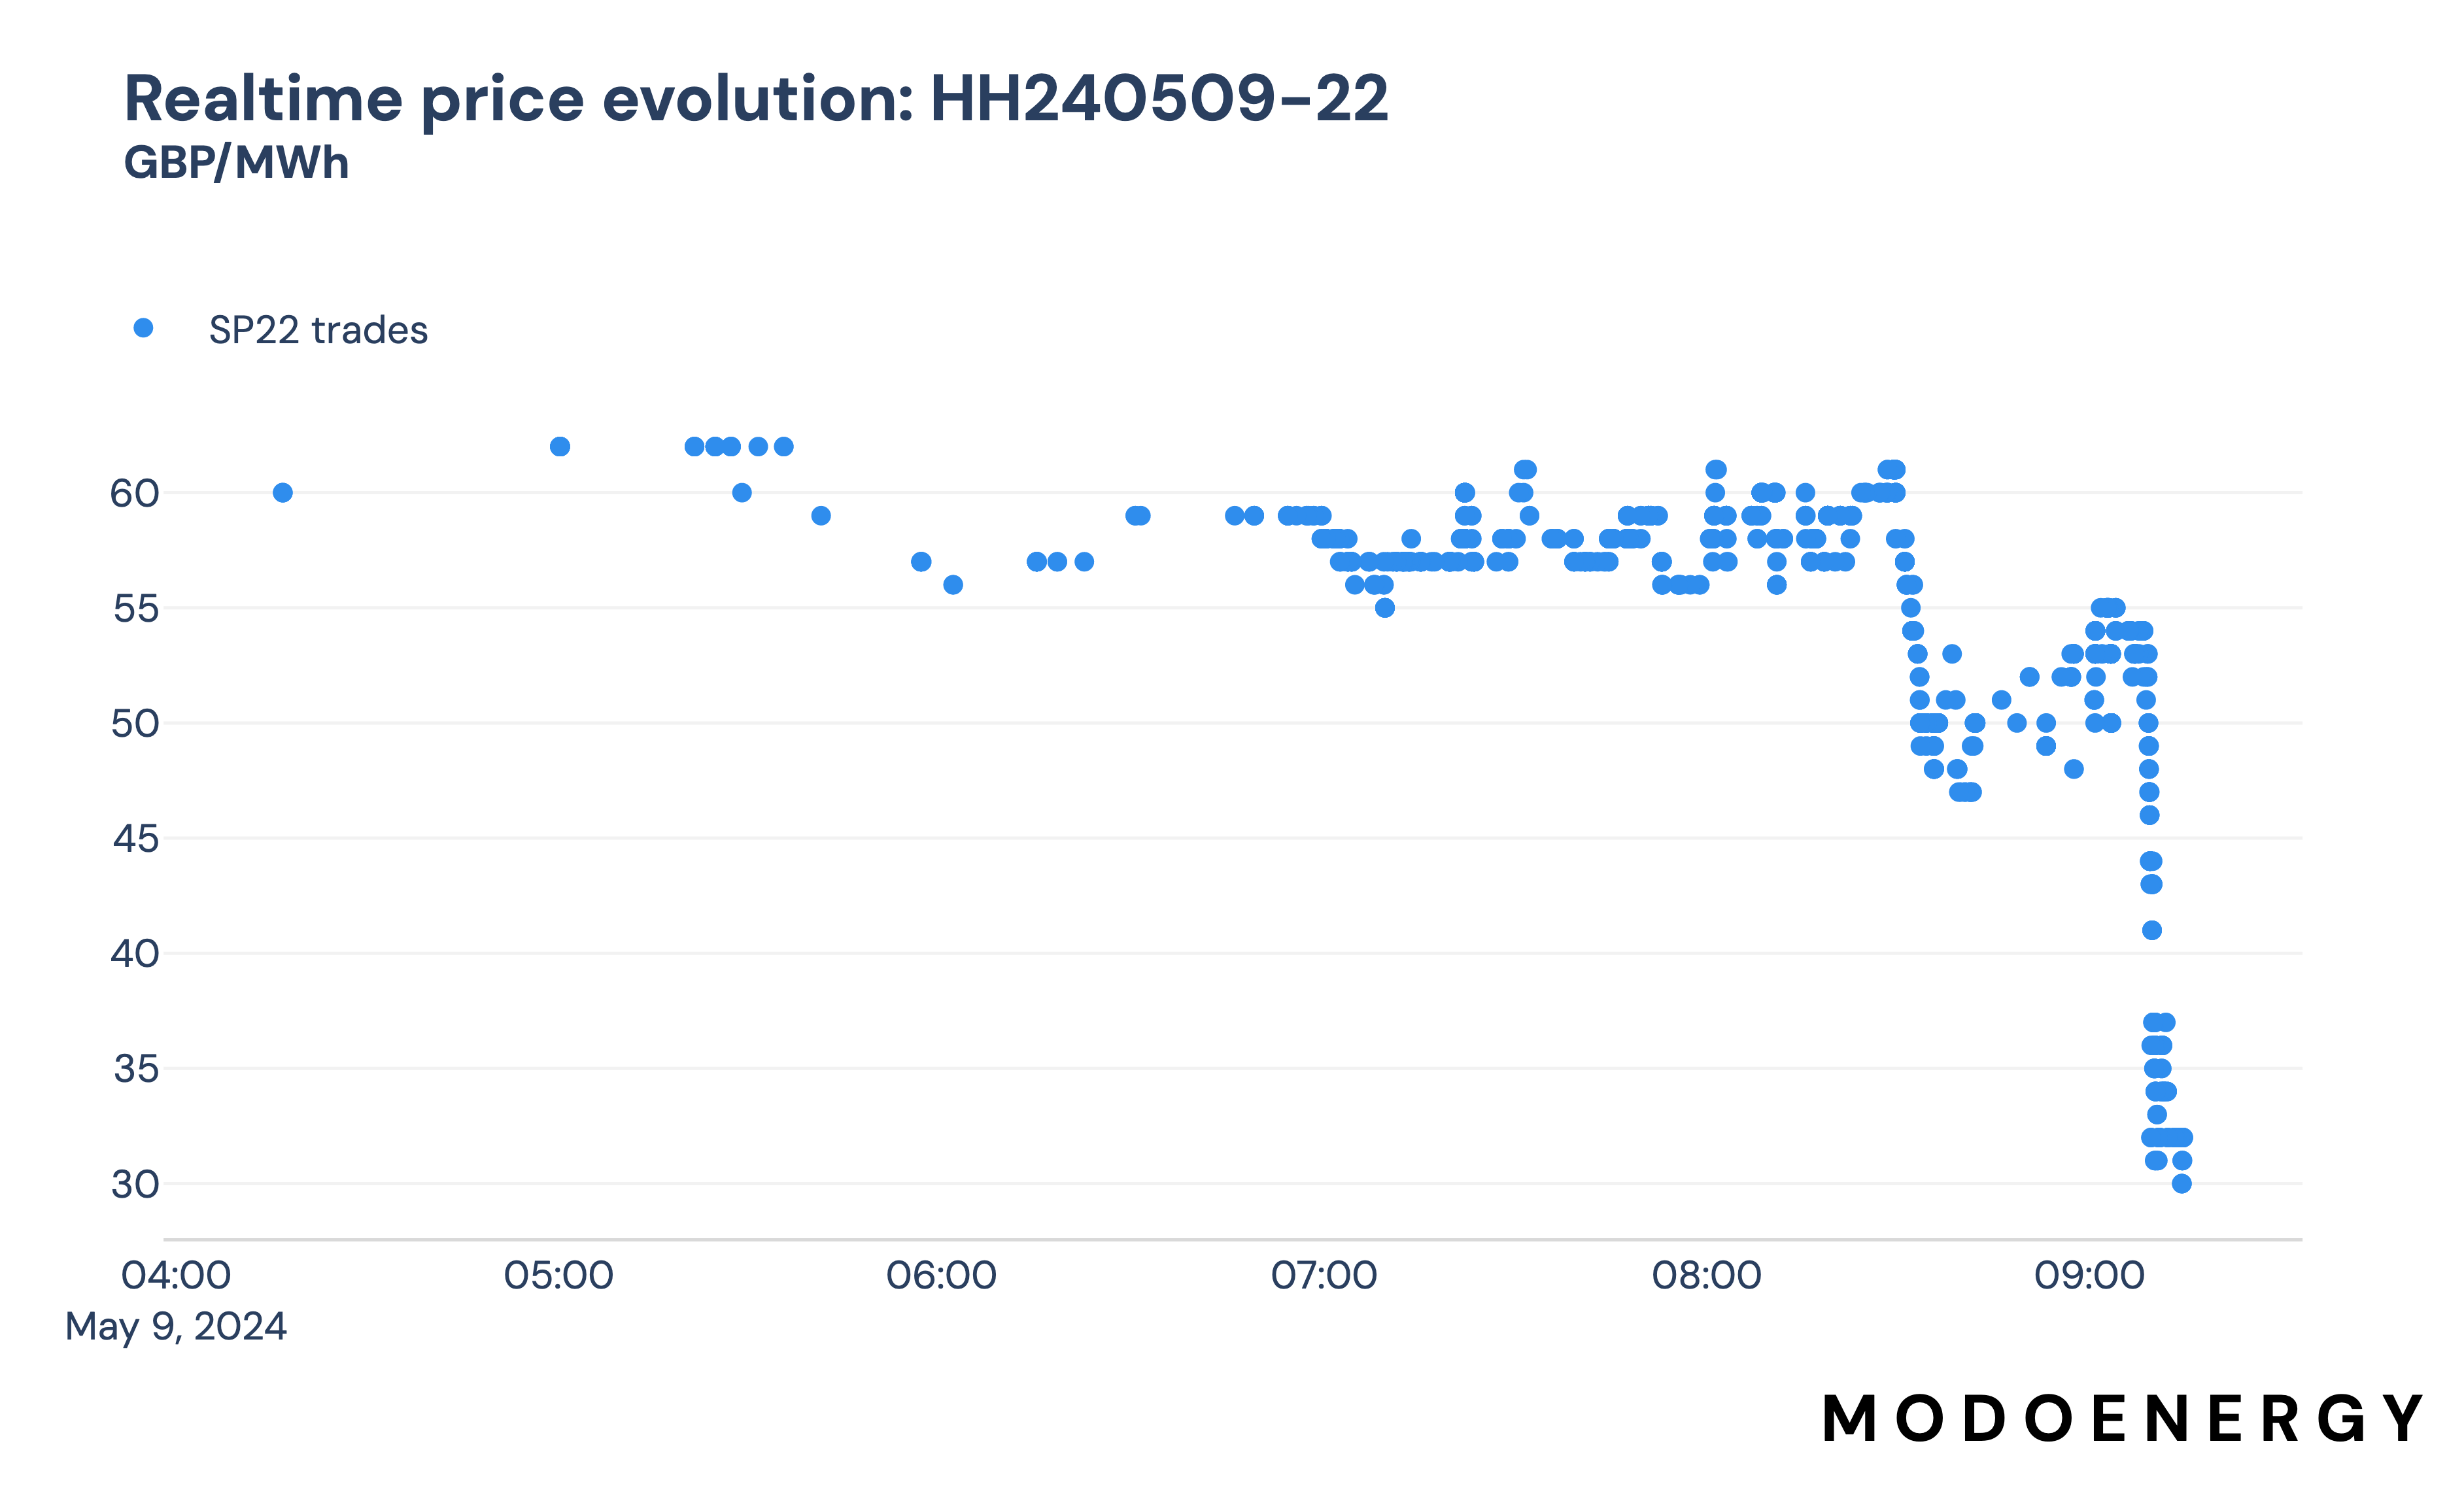
Investigate price history of a specific product
If you are interested in a particular product, you probably want to see exactly how the prices for that product are evolving in real-time.
For example, in the plot below you can see that the price of the HH240509-22 product (half-hour power, for 2024-06-09, settlement period 22) sat around 55 - 60 GBP/MWh until about an hour before delivery. From around 8:15 the price suddenly dropped to 45 GBP/MWh, briefly recovered, then fell to a final closing price of 30 GBP/MWh. By keeping an eye on the price evolution of this product, you could have picked up some relatively cheap power right before delivery.
Visualise the order book for a specific product
Whilst you can learn a lot about a market by looking at the trades, if you really want to understand what's going on you want to look at the order book to understand what prices traders wanted to buy and sell at. Understanding liquidity at different prices can help you place better buy and sell orders by understanding the market competition.
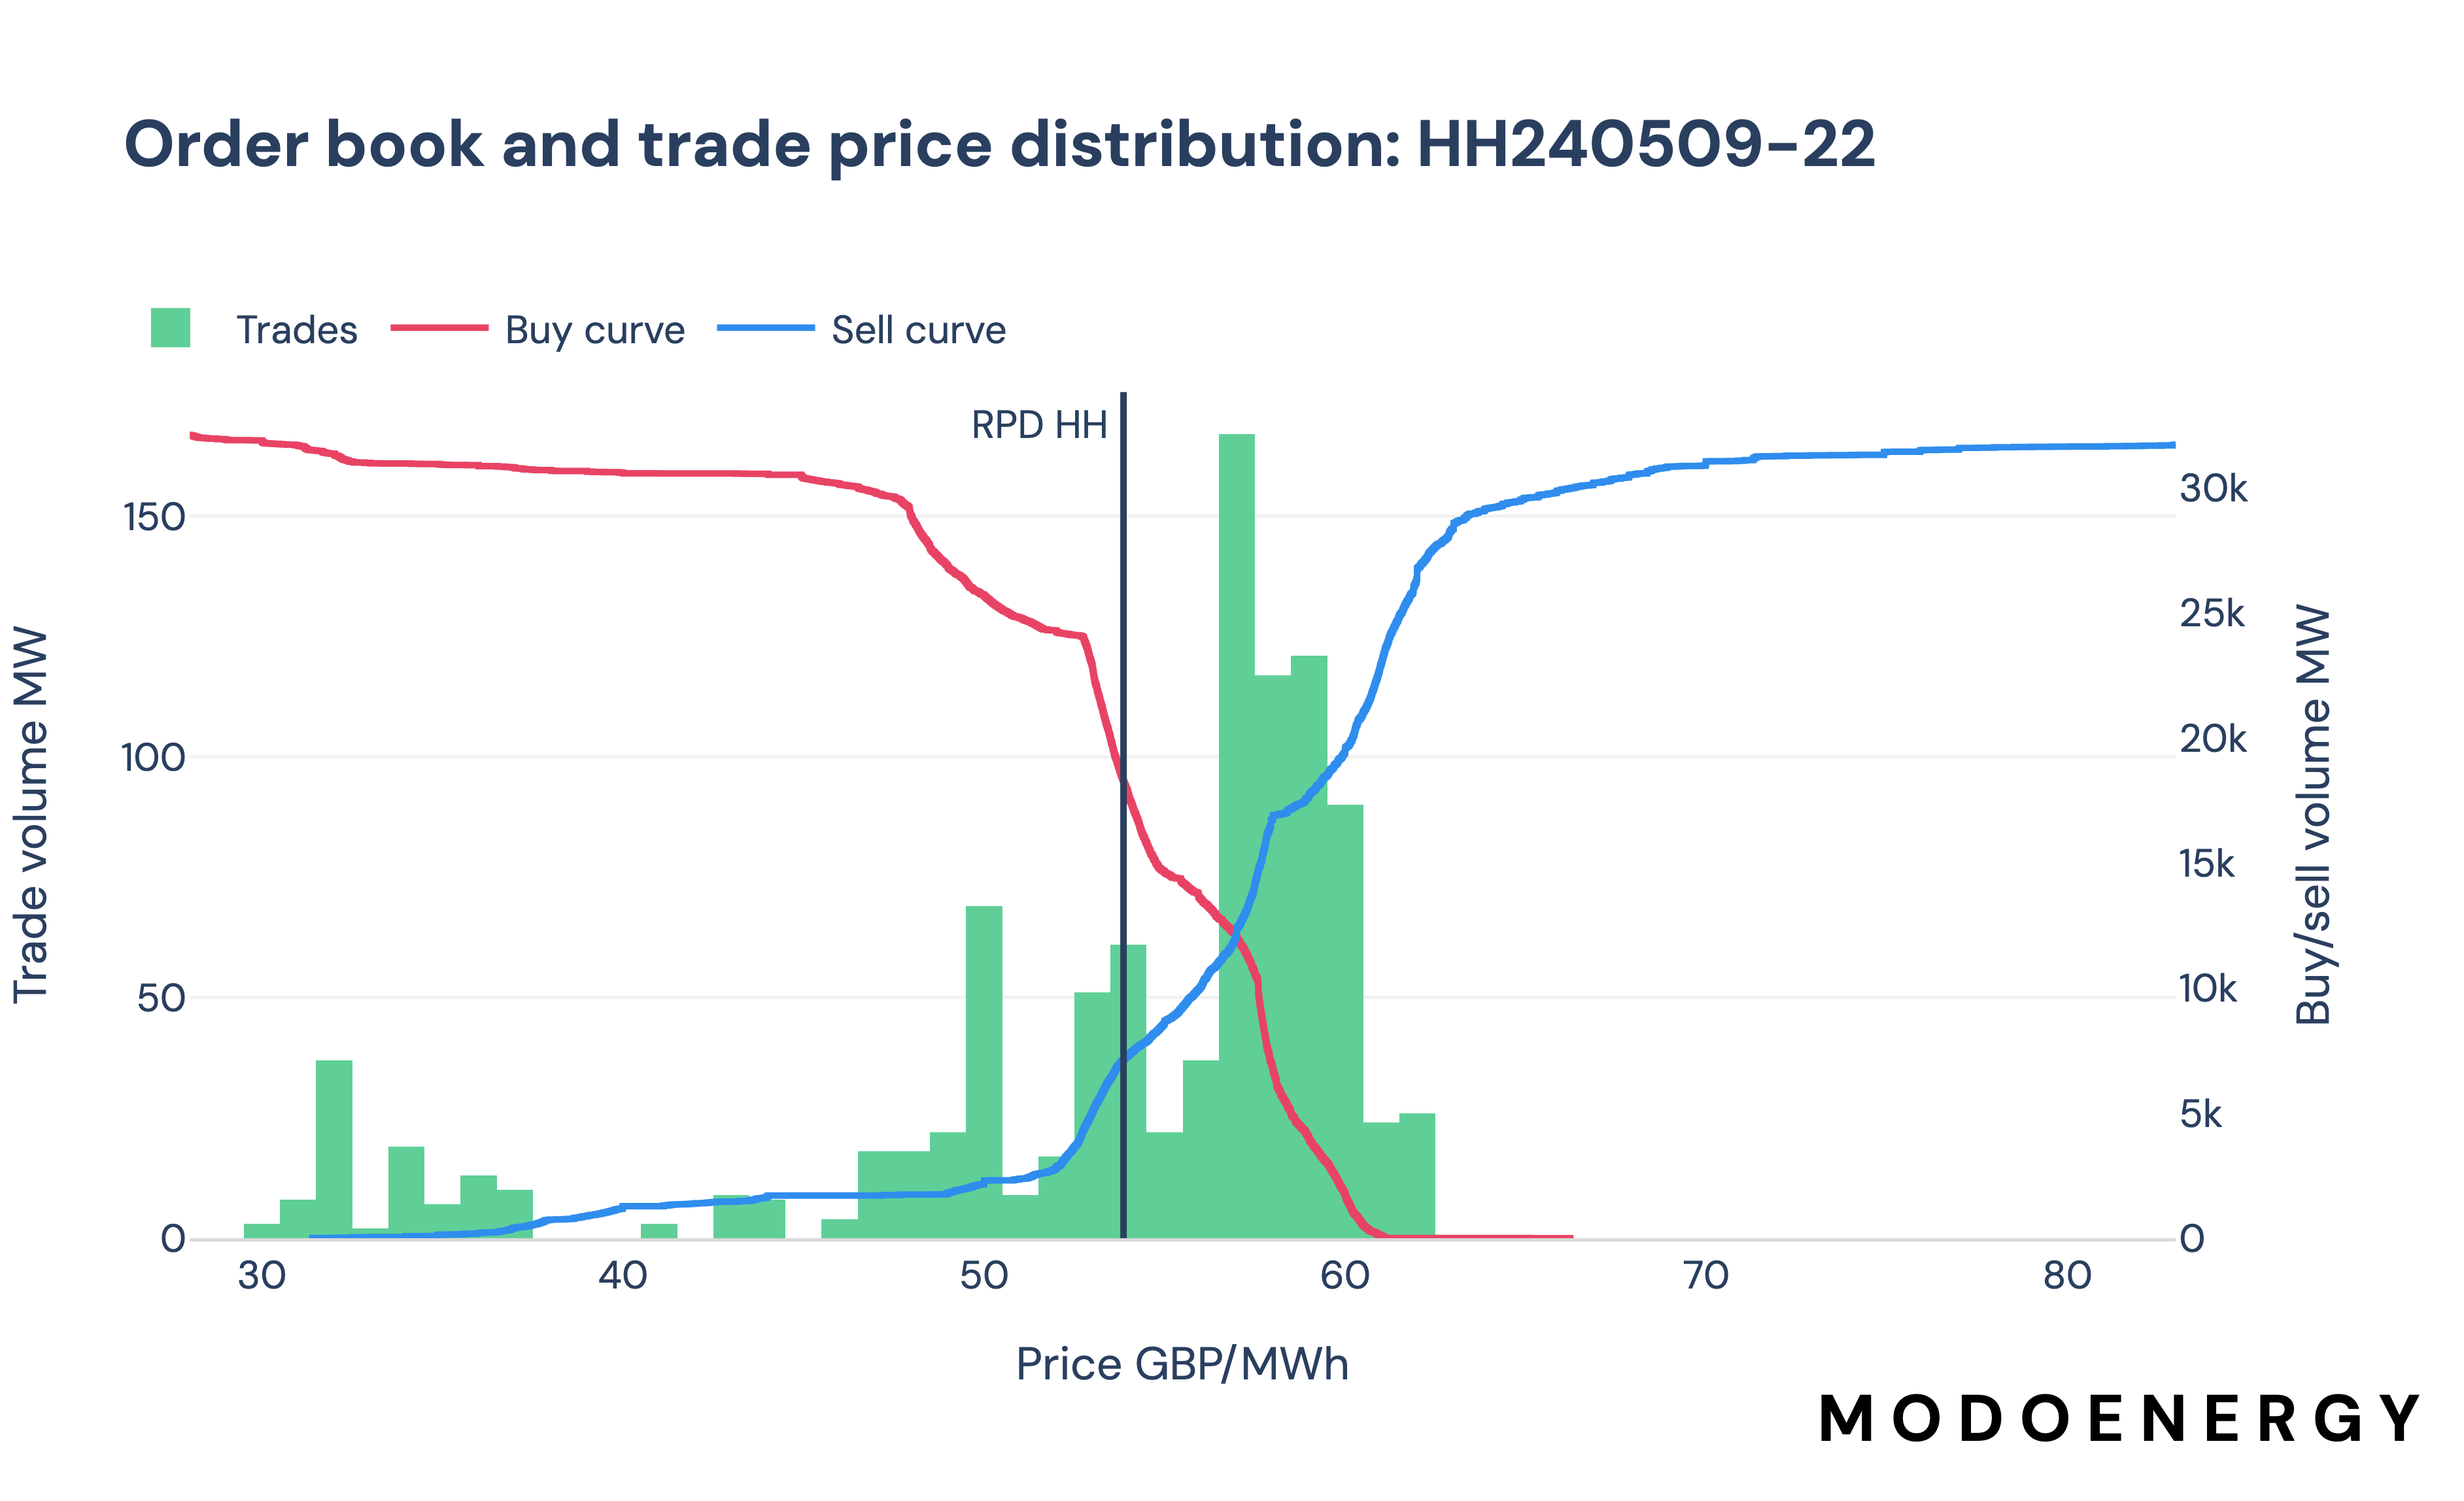
The chart below shows the cumulative buy/sell order volume at different price points, overlaid on the price distribution of trades which executed. Anywhere the buy and sell curves overlap in the price axis, trades will occur, as this shows that traders were willing to sell at prices below what an existing buy order wanted.
For this particular morning peak half-hour product you can see that the total liquidity of the market is around 30 GW on both the buy and sell side, meaning there was lots of opportunity to trade power. This is significantly higher than the total volume traded at 1.5 GW, indicating that this was a particularly deep market.
Psst, if you want to cook up your own version of this chart, we've written anAPI Recipe for that...
Deep dive on how our order book dataset works
At the top of this article I wrote that the continuous intraday power market in GB operates via an open order book, and that traders submit buy and sell orders for a specific delivery window. This is correct, but importantly traders submit buy and sell limit orders.
But what is a limit order I hear you say? A limit order indicates that a trader is willing to buy/sell a quantity of energy at any price below/above a price limit.
Let's take the example order book below. This order book has two orders, a single buy and a single sell order. The buy order has a price limit of 50 GBP/MWh and is looking to buy 10 MW. That means that this trade will transact if there are any sell orders submitted which are willing to sell at a price below 50 GBP/MWh. The example sell order however has a price limit of 60 GBP/MWh - i.e., this trade will only transact if a buy order paying above 60 GBP/MWh is submitted. Therefore, these two trades will not transact.
| Order ID | Order type | Price (descending) | VolumeMW |
|---|---|---|---|
| 1 | Sell | 60 | 15 |
| 2 | Buy | 50 | 10 |
Let's assume though that a third sell order is submitted at 40 GBP/MWh. Because there is an open buy order at 50 GBP/MWh, order 3 will immediately transact with order 2. (Orders transact at the minimum of the buy and sell limits).
| Order ID | Order type | Price (descending) | VolumeMW |
|---|---|---|---|
| 1 | Sell | 60 | 15 |
| 2 | Buy | 50 | 10 |
| 3 | Sell | 40 | 15 |
The order book will then update reflecting the transaction, and a trade will be recorded. Note how order 2 has been entirely removed from the order book, but order 2 is still there. That's because order 3 was selling 15 MW, but order 2 was only buying 10 MW, so a portion of order 2 remains.
| Order ID | Order type | Price (descending) | VolumeMW |
|---|---|---|---|
| 1 | Sell | 60 | 15 |
| 3 | Sell | 40 | 5 |
| Trade ID | Price | VolumeMW |
|---|---|---|
| 1 | 40 | 10 |
Our order book endpoint records every single one of these snapshots of the order book. That means a single trade may well have multiple entries in the order book as the order is updated as it incrementally transacts. For every entry in the order book we record the orderEntryTime and the orderUpdateTime so you can track the history of each order. We also include a final record when the order has been fully transacted with a volume of 0.
Updated 9 months ago